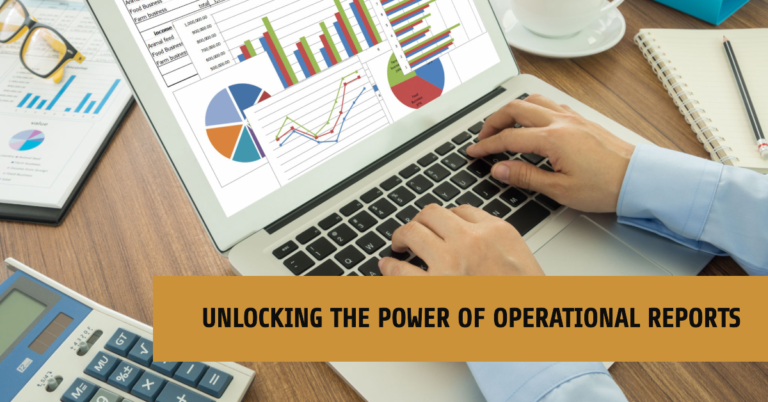
Operational reporting refers to generating timelyreports that offer critical insights into the daily operations of a business. The reports highlight key performance indicators (KPIs), operational metrics and other data-driven insights generated hourly,daily, weekly or monthly to track trends over time. Moreover, they provide users with interactive features like drill-up or drill-down for data exploration to get the most relevant information.
Benefits of Operational Reporting
Most high-performing companies use analytics to guide operational decisions, underlining the strategic importance of data in modern business environments. By leveraging operational reports, businesses can identify inefficiencies in their processes that, if left unchecked, lead to an increase in operational costs.
Traditional static reports often fail to accommodate the fast-paced nature of modern business environments, providing outdated, siloed insights. In contrast, modern operational reporting harnesses real-time data analytics, delivering timely and actionable insights. This supports significant benefits, such as:
Streamlined Reporting: Operational reporting tools equipped with live data feeds offer an unparalleled advantage of receiving up-to-the-minute insights. This real-time information allows businesses to make informed decisions swiftly, responding to changes and opportunities as they arise. Additionally, the use of interactive dashboards simplifies the complexity of data analysis with a user-friendly interface, making it easier for decision-makers to interpret complex datasets and metrics at a glance.
Optimized Resource Allocation: Using operational reporting, businesses can spot key patterns and trends in data for better resource allocation. This strategy involves optimizing inventory to balance availability, streamlining supply chain logistics to cut costs and smarter staff allocation to boost productivity,placing employees where they’re most effective. Through these focused adjustments, businesses can achieve a higher level of efficiency and effectiveness in their operations.
Cost Control:Utilizing technologies like predictive analytics not only facilitates the identification of current patterns and performance issues but also anticipates future trends, enabling proactive decision-making. This strategic foresight sets the stage for smarter resource allocation, ensuring that investments are directed toward the most impactful areas.
Examples of Operational Reporting in Action
The versatility of operational reporting is evident, with its extensive applications across industries and departments
- Manufacturing: Operational reporting helps oversee the entire production process by closely monitoring production output, machine downtimes and conducting regular maintenance. With this, businesses can enhance efficiency and cut down expenses. Additionally, this data-driven approach enables the precise forecasting of raw material requirements, optimizing production pace and analyzing defect frequencies.
- Retail: With insightsinto market trends and product strategies, operational reports empower retailers to monitor each store’s performance, analyze inventory levels to determine restocking needsandidentify high-performing brands and products versus those contributing to deadstock. Retailers can enhance supply chain management, productivity andrevenue by analyzing sales growth and targeting profitable demographics.
- Marketing: In-depth analysis of campaign performance and consumer behavior adds more efficiency to marketing campaigns. By leveraging these insights, marketers can identify which channels excel and which fall short. They can analyze critical metrics such as impressions versus conversions, lead quantity and quality and engagement levels. This data-driven approach not onlyoptimizes cost per click but also maximizes return on investment (ROI).
- Supply Chain Management: Operational reporting allows managers to track inventory against sales, observe trends in inventory turnover, evaluate the average number of units per transaction and closely monitor perfect order fulfillment and backorder rates.This allows inventory accuracy, ensuring that logistics, supplier performance and inventory levels are optimally managed at all times.
Best Practices for Operational Reporting
For effective operational reporting, it’s crucial to organize information clearly, through KPIs that highlight metrics demanding immediate focus. Following this, the report should illustrate trends and patterns, offering a deeper understanding of the operational dynamics over time.
A deep understanding of the report’s audience and their specific needs is essential to make the operational reports useful. An interactive reporting experience enhances the report’s efficiency and value by allowing users to tailor content to their needs. To effectively serve multiple groups, a separate dashboard with advanced filtering and drill-down capabilities also helps.
A well-crafted report should transcend basic data presentation, weaving the numbers into a compelling narrative that highlights trends, pinpoints issues and suggests potential solutions.
To maximize utility, operational reports must be maintained with regular updates, reflecting the most current data to support informed decision-making. Furthermore, they should be easily accessible to all relevant stakeholders, regardless of their technical expertise or role within the organization.
Conclusion
Operational reporting is not just about tracking performance; it’s about enabling a culture of continuous improvement and strategic foresight. By embedding operational reporting into the fabric of business operations, managers can unlock the potential to not just react to the market but to anticipate and shape it.
Pls add a bit more here about versatility of operational reporting for different industries or use cases [VS1]
done
PLs include this as well here: “It should begin with the most critical KPIs first, gradually moving to the next level of insights like trends and patterns. The last level should list more detailed and granular information to provide a holistic view.”
Same as above:
“In case the report is serving more than one group or has shared interest, a separate dashboard or functions like filter, sort, and more should be provided.”

